Infographics? Yes, please!
Infographics. We see them everywhere, but what exactly is an infographic and how can we use them in class? At its most basic level, it’s a visual representation of information. As Jonna Mae Magno describes in her blog, infographics are “visually simplified representations of complex data, aiming to engage interests, and deliver an easily understandable message” (source). Here are just a few examples of the different kind of infographics out there.
 |
| A simple Google search will show many options of infographics on any given topic |
As a means of “engaging the interests” of her students in the target language, Profe +Tona Costello has recently started using infographics as conversation starters in all of her classes. In order to use these dynamic information sources, Ms. Costello charged her students with finding infographics about childhood obesity in Italian.
 |
| Infographic on childhood obesity in Italian |
The students were able to search the internet and instantly find a plethora of options. Ms. Costello then created a media album in +Schoology and asked all of the students to post their infographics. Once the students had all posted, each group looked through the options, agreed on a common infographic and then spoke about it, in Italian, for the set amount of time. Ms. Costello was pleased with the conversations that the students had and was excited that they were interacting with authentic materials they had found. Even more, she now has a large pool of infographics on the topic to use for future activities.
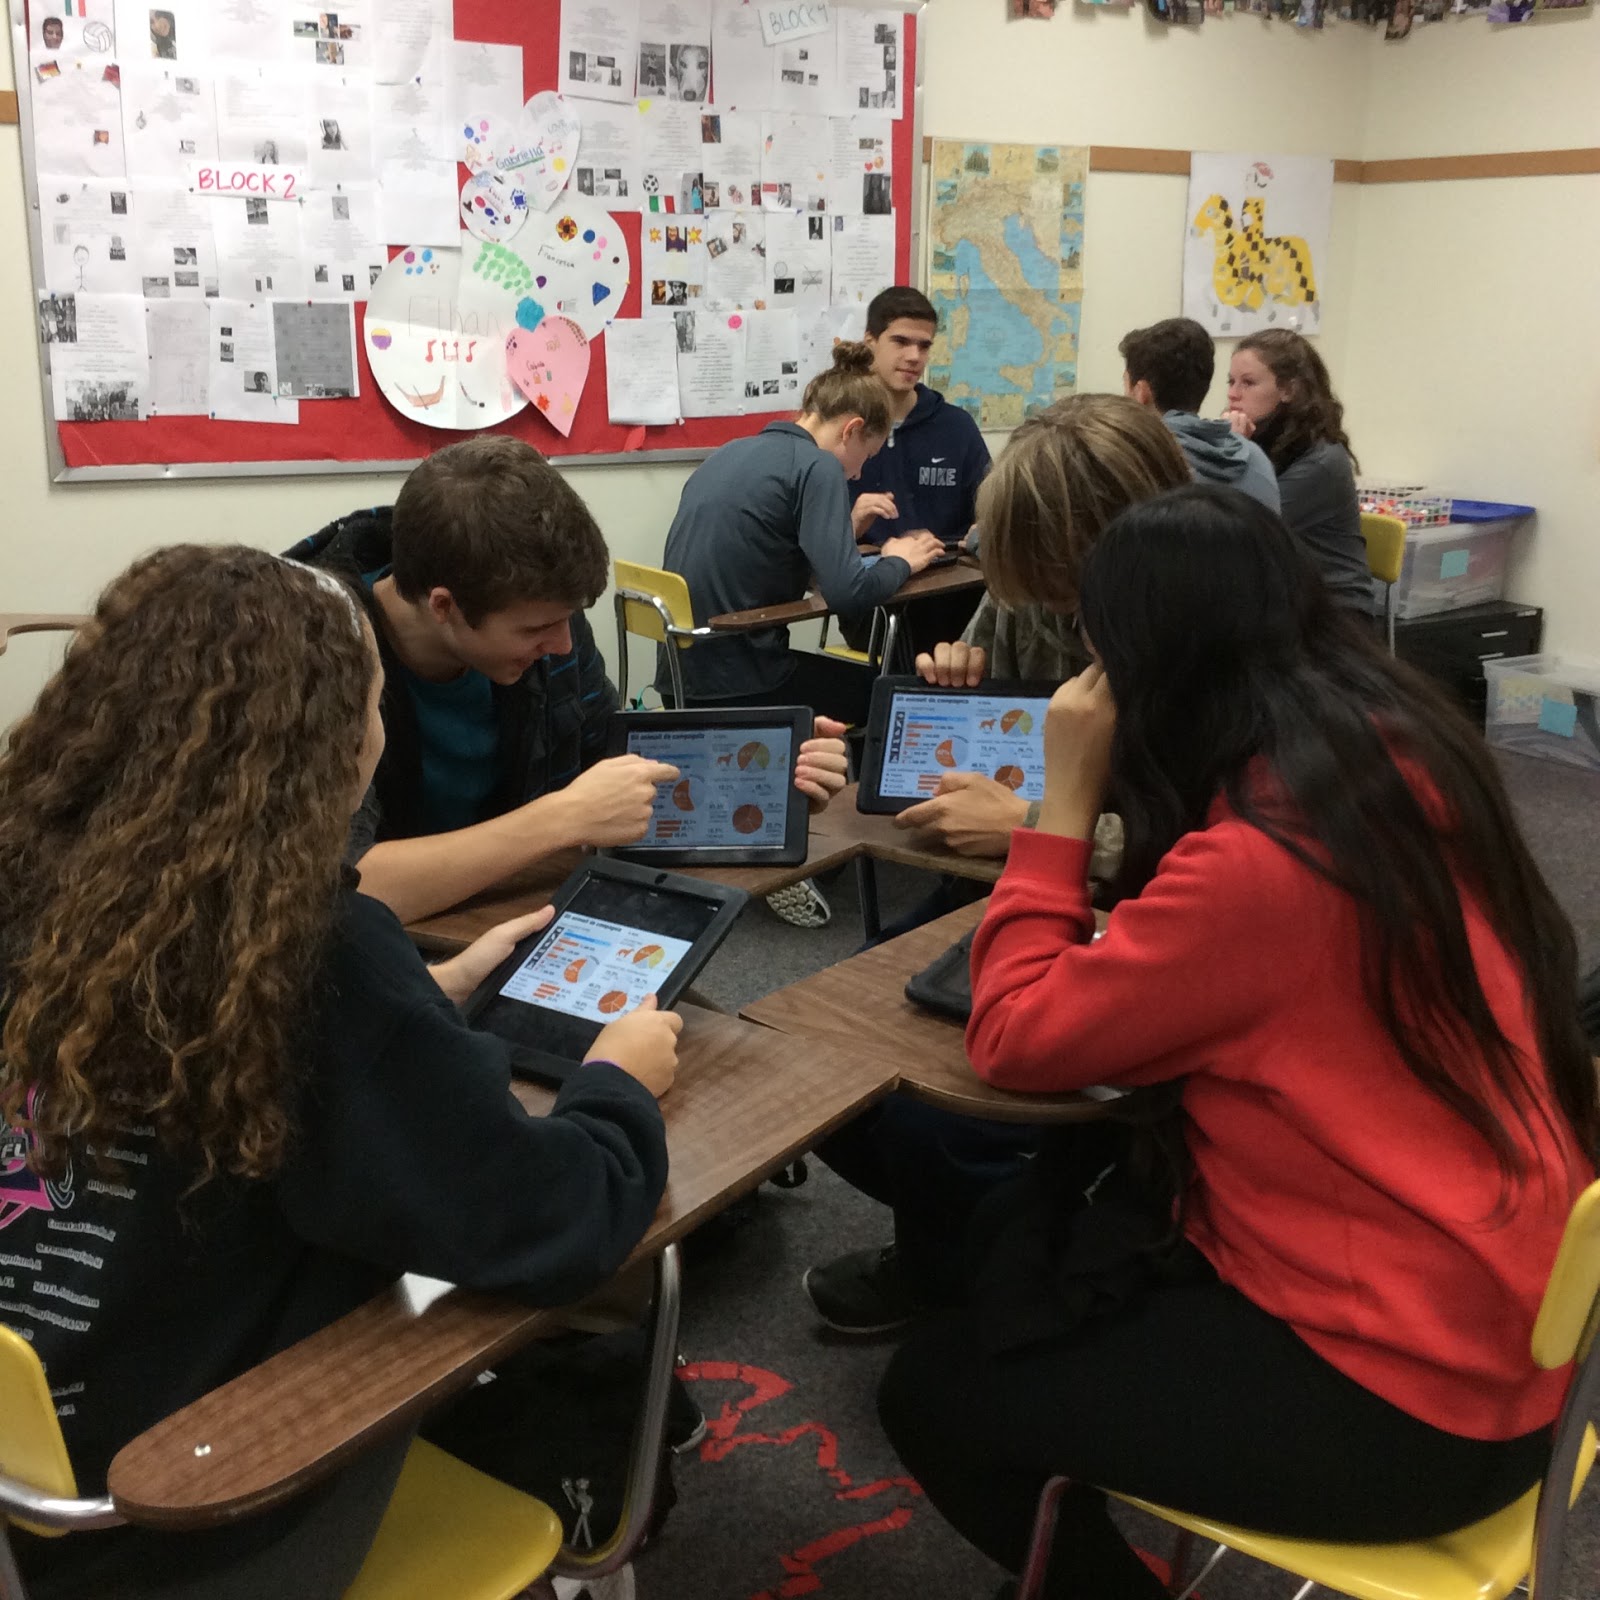 |
| Students using infographics to start conversations |
Another use of infographics in the classroom to consider is moving the student from the role of consumer to that of the creator. With sites like +Piktochart, Vennage , and +Canva, students can easily take their own information, data, ideas, etc. and create an infographic for a variety of purposes. Putting the students in charge of the design helps them to internalize the information and take ownership of their own learning.
- have students find infographics as a way to start a classroom debate
- create an infographic as an alternative to essay writing
- use an infographic as a presentation tool (both students & teachers)
- have students create an infographic comparing and contrasting a character from a novel and a historical figure
- ask students to visually represent collected data with an infographic
Have you used infographics in your classroom? Please share your ideas in the comments section. Need some more support? Talk to Ms. Bodden or one of your DTCs!

Comments
Post a Comment